One of the advantages of SCADASuite is that it provides detailed diagnostic logging. This includes information about changes made using the PC Configuration Program and application specific diagnostic and change logs from applications on the RTU.
Log entries pertaining to the PC Configuration Application are created automatically as things are happening. Logs from an RTU must be retrieved manually using a button on the Sync With RTUtab.
Each application on the RTU has two logs available. The Configuration Change Log shows configuration parameter value changes. The Diagnostic Log shows information about the execution of the application, licensing status, unusual conditions and so on. Logs are stored on the RTU in a compact binary format and rehydrated by the PC Configuration Application when the are retrieved from the RTU.
There is also a Startup Log that is generated by the SCADASuite supervisor program on the RTU. This log contains general information that doesn't apply to any specific application.
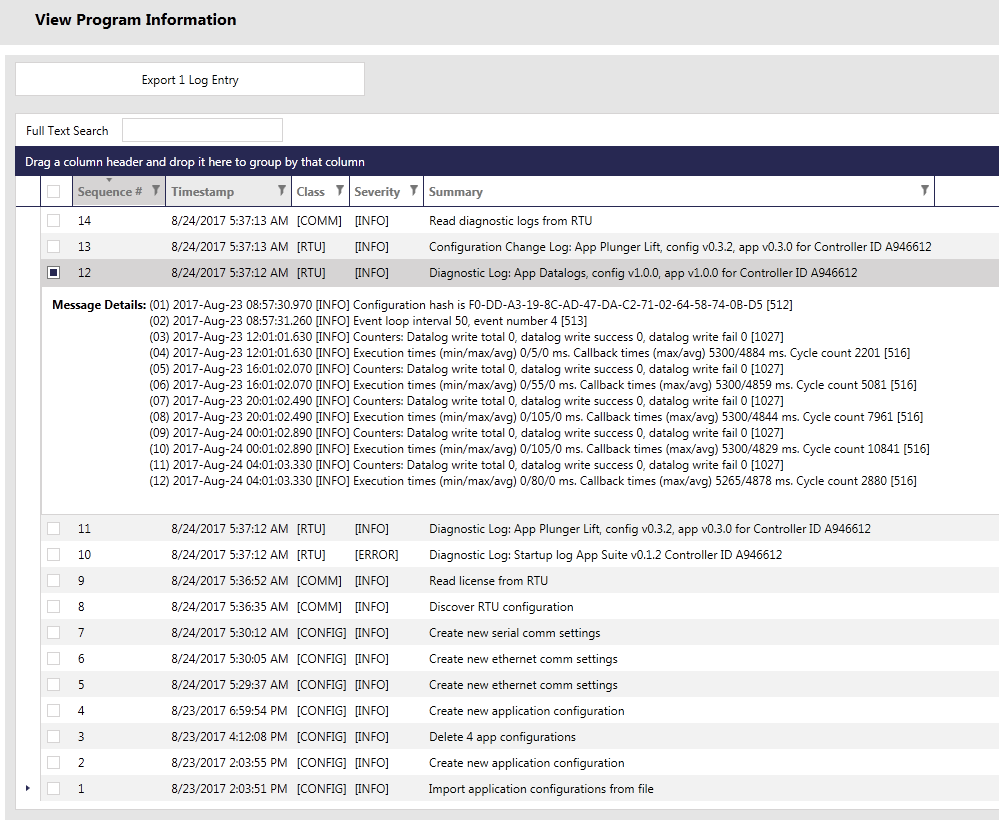
Log Overview
Every log entry has some summary information that is shown in a grid as well as detailed information. Detailed information can be viewed by selecting the log entry using the left most column.
The entire log can be filtered by column, or grouped together by any column. For example, it is possible to group all Error entries together, or to filter out entries before a certain time. To filter a column, click on the funnel icon in the column header and choose your options. To group by a certain column, grab the column header and drop it on the dark blue bar.
It is also possible to use the Full Text Search field to narrow the view to log entries for a specific RTU, or for a specific message. Enter an RTU's controller ID in this field to find all diagnostic logs from that RTU, for example.
The log is persistent, and up to 1024 log entries are stored in the database. However, each time the PC Configuration Program is started, it will clear the log of the oldest entries if the number of entries is greater than 1024. This will result in a permanent loss of the log entry.
Older log entries are deleted when the PC Configuration Program is started, and the number of log entries in the database is restricted to 1024 entries.
Log Overview
Summary Information
Each log entry contains the following summary information:
Sequence. This is the primary key of the log entry in the database and indicates the order that log entries were created in. Time stamps cannot be relied on for ordering because of clock changes, clock offsets in the RTU, different time zones and so on.
Timestamp. This is the time when the log entry was created. For entries from the PC Configuration App, this is the same as the time when the action occured. For logs retrieved from an RTU, this is when the log was retrieved.
Class. This describes the type of log entry. Possible options include:
COMM. Describes communications with an RTU.
RTU. A log retrieved from an RTU.
CONFIG. A local configuration change made in the PC Configuration application.
Severity. This summarizes the content of the log entry. It always indicates the highest severity of the messages in the log entry. For example, if a log is retrieved from an RTU, and it contains all entries with a Severity of INFO, except for one entry with a Severity of ERROR, the summary in this column with read ERROR. It can have three possible values:
INFO. This entry is informational only.
WARNING. This entry may have information that is possibly a problem.
ERROR. This entry contains information about something unexpected that happened.
Summary. This column contains a summary of the log entry.
Message Details
Each log entry has Message Details. View the message details by clicking in the selection column. The Message Details contains detailed diagnostic information.
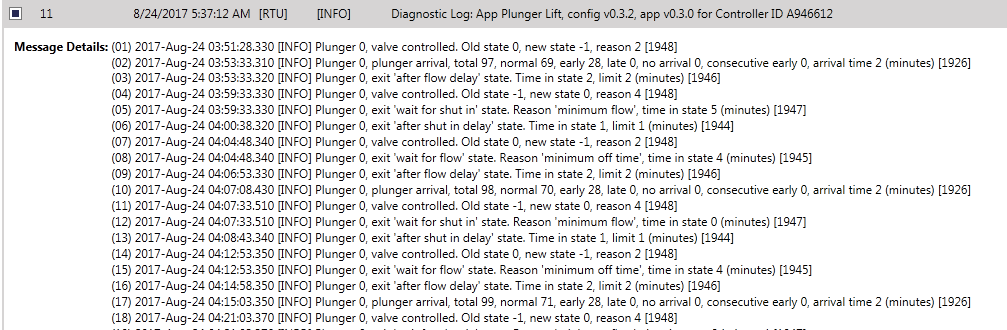
Application Diagnostic Log
Each application on an RTU creates a detailed Diagnostic Log. An example of this type of log is shown below. This is the log for a Plunger Lift application with one control loop enabled. Time stamps in the message details reflect the time of the clock on the RTU when the log entry was generated.
Log entries are stored on the RTU in a compact binary format (no strings, just numbers). The numbers are converted into strings by the PC Configuration Program when the log is retrieved. Each log entry contains an event number which is shown at the end of the entry in square brackets. The PC Configuration Program uses this event number to decide how to decode the numeric entry.
Plunger Lift Diagnostic Log
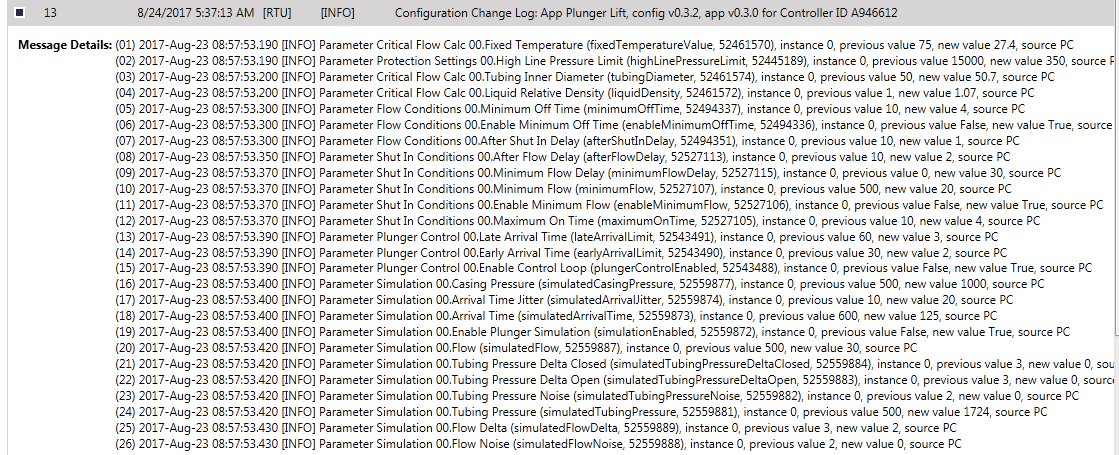
Configuration Change Log
Each application on an RTU has its own configuration change log. This log tracks changes in numeric configuration parameters. Because of space constraints, changes to strings are logged, but the previous value and new value are not logged. Time stamps in the message details reflect the time of the clock on the RTU when the log entry was generated.
Plunger Lift Configuration Change Log
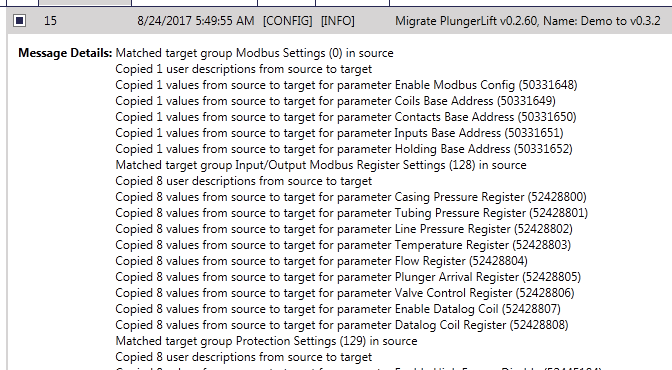
Migration Log
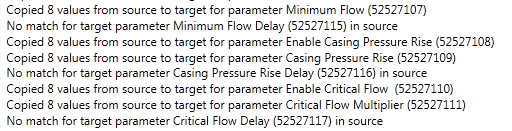
When an application configuration is migrated from one version to another version (Version tab), a detailed log entry is generated. Examples of this type of log entry are shown below. Examine the log entry carefully to make sure that the migration went as expected. The second screen grab shows the case where a configuration parameter could not be matched.
Plunger Lift Migration Log
Plunger Lift Migration Log - No match for Minimum Flow Delay
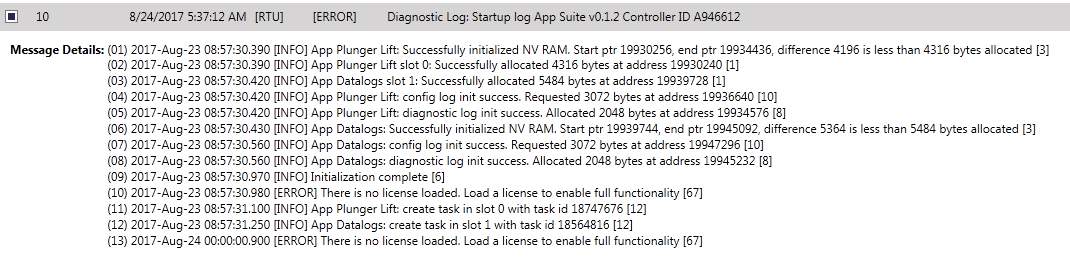
Startup Log
In addition to application specific logs, the SCADASuite program on the RTU creates a startup log. This log describes the initialization of the system and if there were any errors during initialization. A new set of log entries is generated every time the program is started.